I’ve been discussing the consumer sector of the market recently, looking at Consumer Staples ($XLP) relationship to the S&P 500 and the divergence in momentum that’s lead to substantial weakness in previous years.
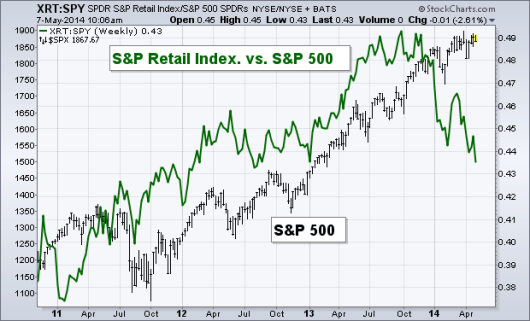
However, today I want to take another look at the relationship between the broader S&P Retail Index ($XRT) and the S&P 500 ($SPY). Typically we see the ratio between the retail space and the S&P track along with the overall equity market. In 2013 the 60-day correlation between the ratio and the market was 0.87, a sign that things were healthy and the up trend was being confirmed. The current correlation is -0.36, something isn’t right. Like I showed with the Relative Strength Index for the ratio between $XLP and $SPY in my Technical Market Outlook this week, the consumer segment of the market, shown today through the S&P Retail Index is showing signs of worry.
Mr. Market is trying to tell us something right now, and it seems he’s choosing to do it through the Retail sector, and specifically Consumer Staples. The divergence that’s taking place as the chart below shows is worsening. The 60-day correlation has not been more negative than it is today since 2007. As we enter the tumultuous period of seasonality, yellow flags (and some may feel they are red flags) are popping up and are becoming hard to ignore.
Disclaimer: Do not construe anything written in this post or this blog in its entirety as a recommendation, research, or an offer to buy or sell any securities. Everything in this post is meant for educational and entertainment purposes only. I or my affiliates may hold positions in securities mentioned in the blog. Please see my Disclosure page for full disclaimer. Connect with Andrew on Google+, Twitter, and StockTwits.


Pingback: Wednesday links: two huge attributes | Abnormal Returns
Pingback: The Retail Index Continues to Get Pounded – Andrew Thrasher | Marty Investor